
Automated Client Reporting for Agencies: A System That Cuts Reporting Time Without Losing the Story
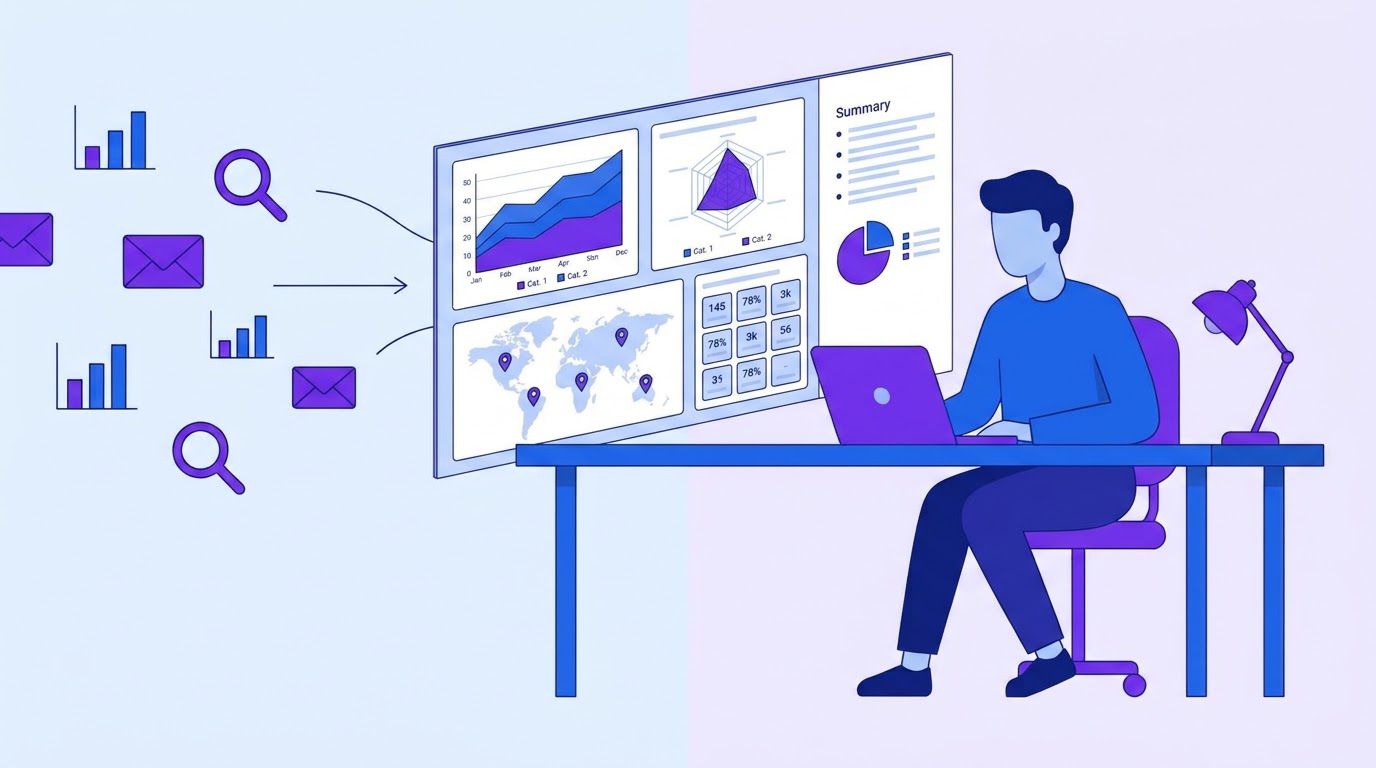
It is the 3rd of the month, and an agency owner has twelve reports to send. For each one she exports numbers from three platforms, pastes them into a slide template, screenshots two charts, writes four sentences about what happened and half-remembers why traffic dipped in the second week. By the 6th she has finished nine. The other three clients email to ask where their report is. (An invented scene, and one most agency owners will recognize.)
Client reporting is the recurring document or dashboard an agency sends to show a client what was done and what it produced. Done by hand it consumes days every month. Done with software alone it often produces a dashboard nobody reads. This guide describes a system in between: automated client reporting that gathers and checks the numbers, drafts the summary, and leaves a person 45 minutes per client to write the part that matters. It covers the architecture, a one-page template, report templates for SEO, ads and social, an AI-assisted draft with a review checklist, a reporting calendar and a way to automate the plumbing with n8n.
A note on what this is. The 45-minute figure is a time budget we propose, not a result we measured. We did not time real agencies, and we publish no before-and-after numbers from client work. Where we give arithmetic, it uses invented numbers that you can replace with yours. Tool prices come from each vendor’s own pricing page, read on November 13, 2026, and they change. Every example report, client and figure is invented and labeled.
- Reporting is mostly assembly. Assembly can be automated. Interpretation cannot, and it is what the client values.
- Build in layers: sources, a consolidated sheet per client, a one-page template, an AI draft, a person.
- Give the client three things on one page: what we did, what it produced, what we do next.
- Choose metrics from the client’s goal, not from what the platform offers.
- Let AI draft, not decide. It may only use numbers you give it and may not invent reasons for changes.
- Check the data before the draft: missing values and sudden swings are flagged by a rule, not noticed by luck.
- The real cost of manual reporting
- The architecture: from sources to a one-page report
- The three sections a client reads
- Report templates for SEO, ads and social
- An AI-assisted draft with a 15-minute review
- Reporting rhythm: who gets what, and when
- Automating the plumbing with n8n
- A two-week rollout
- When it is time to hand it to someone
- Frequently asked questions
- Sources
The real cost of manual reporting
Manual reporting is expensive in a way that is easy to underestimate, because it happens in small pieces: an export here, a screenshot there, an hour of formatting. Add the pieces up for one month and the total is usually larger than the owner thinks.
A calculator you can fill in
| Input | Your number | Invented example |
|---|---|---|
| Active clients who get a report | A | 12 |
| Hours per report today (collecting, formatting, writing) | B | 6 |
| Hours per report with the system (target) | C | 0.75 (45 minutes) |
| Cost of an hour of your team’s time | D | $50 |
| Current monthly cost | A × B × D | 12 × 6 × 50 = $3,600 |
| Target monthly cost | A × C × D | 12 × 0.75 × 50 = $450 |
| Difference per month | (A × B × D) − (A × C × D) | $3,150 |
| Hours freed per month | A × (B − C) | 12 × 5.25 = 63 hours |
On these numbers the agency spends 72 hours a month on reporting (12 × 6) and would spend 9 hours (12 × 0.75) with the system, a reduction of 87.5%. The figures are invented, and the target is a design goal, not a promise. What the arithmetic leaves out matters as much.
- Setup time. Building the template, the sheet and the connections is real work. If it takes 4 hours per client once, that is 48 hours for twelve clients, so the first month may cost more than it saves.
- Tool costs. Section 2 shows what two vendors charge, and the monthly figure can offset part of the saving.
- Maintenance. Connections break when a platform changes a login or a field. Budget some time every month.
- The savings are only real if the freed hours are used. If the time disappears into other work, the benefit is capacity, not cash.
The costs that do not show on a timesheet
- Late reports erode trust. A client who has to ask for a report starts to wonder what else is late.
- Rushed reports say less. When assembly takes five hours, the thinking gets the last twenty minutes.
- Inconsistent numbers. Two people pulling the same metric on different days get different answers, and the client notices.
- Key-person risk. If one person knows how the reports are built, a holiday becomes a delivery risk.
Where the 45 minutes go
A target is only useful if it has a budget. Here is one for a standard monthly report. Each line is a proposal for you to test, not a measurement.
| Minutes | Task | Done by |
|---|---|---|
| 10 | Check the data flags: missing values, sudden swings, anything marked for review | Person |
| 0 | Pull data, fill the sheet, generate charts and the draft | System |
| 15 | Review the AI draft, correct it and write the interpretation and the recommendation | Person |
| 5 | Add annotations to charts (a launch, an outage, a holiday) | Person |
| 10 | Write the cover email and prepare talking points for the client call | Person |
| 5 | Log what you changed and schedule the next report | Person |
| 45 | Total per client |
If your reports take longer, look at the ten minutes on data checks and the fifteen on review first. They are where the time hides when the underlying data is messy, which our guide to CRM data cleanup covers for the sales side of the same problem.
The architecture: from sources to a one-page report
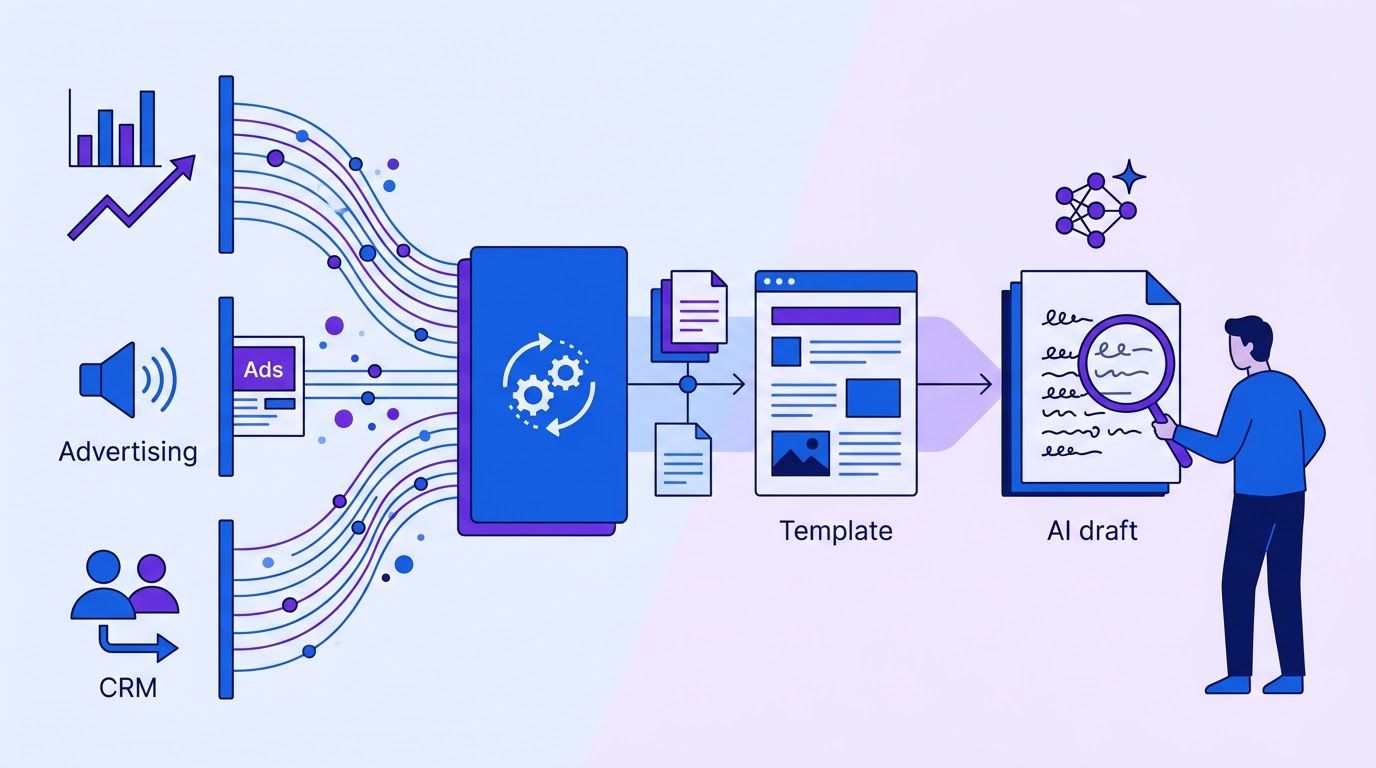
A reporting system has five layers. Each can be done by hand or by software. The order does not change.
| Layer | Job | Examples |
|---|---|---|
| 1. Sources | Where the numbers originate | Search Console, Google Analytics, ad platforms, social platforms, CRM, call tracking |
| 2. Consolidation | One place, one set of metric names per client | A Google Sheet per client, a data warehouse, or a reporting tool’s own storage |
| 3. Checks | Catch missing data and sudden swings before anyone reads it | A rule that flags changes beyond a threshold (Section 7) |
| 4. Template and draft | Turn the numbers into a page and a first-draft narrative | A slide or document template, a dashboard, an AI draft |
| 5. Interpretation | Explain why, say what it means, recommend what is next | A person |
Layer 2: a metrics dictionary
The quietest source of reporting errors is inconsistent naming. One platform calls it conversions, another leads, a third results. Before you automate anything, write a metrics dictionary: for each metric you report, its exact name, where it comes from, how it is calculated and what it does not include.
METRIC: Organic clicks
SOURCE: Search Console, Performance report, web search
DEFINITION: Clicks on results for the verified property, date range = calendar month
EXCLUDES: Discover, Images, News (unless stated)
OWNER: [person who maintains the connection]
NOTES: Compare with same month last year, not only last month.
Tools: what some of them cost
Many agencies buy a reporting tool for layers 1, 2 and 4. Below is what three options say on their own pages. We do not rank them, and we have not used them on client work. Read the live pages before deciding, because prices and plans change.
| Looker Studio | AgencyAnalytics | Swydo | |||||||||||||||||||||||||||||||||||||||||||||||
|---|---|---|---|---|---|---|---|---|---|---|---|---|---|---|---|---|---|---|---|---|---|---|---|---|---|---|---|---|---|---|---|---|---|---|---|---|---|---|---|---|---|---|---|---|---|---|---|---|---|
| P | r | o | d | u | c | t | p | a | g | e | s | ||||||||||||||||||||||||||||||||||||||
| [ | [ | L | o | o | k | e | r | S | t | u | d | i | o | | | h | t | t | p | s | : | / | / | l | o | o | k | e | r | s | t | u | d | i | o | . | g | o | o | g | l | e | . | c | o | m | / | ] | ] | |
| [ | [ | A | g | e | n | c | y | A | n | a | l | y | t | i | c | s | | | h | t | t | p | s | : | / | / | a | g | e | n | c | y | a | n | a | l | y | t | i | c | s | . | c | o | m | / | ] | ] | ||
| [ | [ | S | w | y | d | o | | | h | t | t | p | s | : | / | / | w | w | w | . | s | w | y | d | o | . | c | o | m | / | ] | ] |
Suppose an agency has 12 clients, each with 2 connected sources (say Google Analytics and Google Ads). Using the prices above, and ignoring annual discounts, taxes and add-ons:
- Per-client pricing at $20: 12 × $20 = $240 a month.
- Per-source pricing: 12 × 2 = 24 sources. The base $69 covers 10, and the other 14 cost 14 × $4.50 = $63, for $132 a month.
The order flips as the number of sources per client rises or falls, as add-ons are used and as plans change. The point is not which is cheaper. It is that you should calculate the cost for your number of clients and sources, because the two models scale differently.
A spreadsheet and a few n8n steps can replace layers 2 and 3 at a lower cost and with more control, at the price of building and maintaining them. Which is right depends on how many clients you have, how many sources each uses and how much time your team has to maintain connections.
The three sections a client reads

Most clients do not want a data pack. They want to know three things: did you do the work, did it help and what happens now. A good monthly marketing report answers those in that order, on one page, before any detail. Everything else is an appendix that the client can open if they wish.
The three sections
| Section | Question it answers | Length | Contents |
|---|---|---|---|
| 1. What we did | Did you earn your fee? | 5 to 8 bullet points | Concrete actions completed this period, in plain words: pages published, campaigns launched, tests run, issues fixed. |
| 2. What it produced | Did it help? | 3 to 5 numbers, each with a comparison and one sentence | Metrics tied to the client’s goal, compared with the previous period and, where seasonal, the same period last year. |
| 3. What we do next | What do you need from me? | 3 bullets and one decision | Planned work for the next period, what you need from the client, and one recommendation or decision. |
The page as a template
[CLIENT]  |  [MONTH YEAR]  |  Prepared by [NAME]

HEADLINE (one sentence a busy person can repeat to their boss):
"[Metric tied to goal] was [number], [up/down/flat] [x]% on [period]. [One-clause reason.]"

1. WHAT WE DID
 - [Action 1, plain words]
 - [Action 2]
 - ... (5 to 8)

2. WHAT IT PRODUCED
 | Metric | This period | Last period | Same period last year | Note |
 | [goal metric 1] | | | | [one sentence] |
 | [goal metric 2] | | | | |
 | [goal metric 3] | | | | |
 What changed and why (2 to 3 sentences, only reasons we can support):
 ...
 What we do not know yet:
 ...

3. WHAT WE DO NEXT
 - [Planned work]
 - [Planned work]
 - Needed from you: [item, date]
 DECISION / RECOMMENDATION: [one sentence]

APPENDIX (link): [full dashboard or data tables]
Rules that make the page work
- Lead with the headline. If the client reads only one sentence, it should be the true one.
- Tie every number to a goal. If you cannot say why the client should care about a metric, leave it in the appendix.
- Always compare. A number without a comparison is not information. For seasonal businesses, use the same month last year as well as the previous month.
- Say what you do not know. "We do not yet know whether the July dip came from the update or from holidays" builds more trust than a confident guess.
- End with a decision. A report that asks for nothing invites no response.
- Reporting everything the platform offers. Fifty metrics hide the five that matter.
- Vanity metrics as headlines. Impressions and followers can rise while leads fall.
- Explaining a drop with a reason you cannot support. If you do not know, say so and say how you will find out.
- Burying bad news on page nine. The client will find it, and will ask why it was hidden.
- Changing the metrics every month. If you must change them, say why, and show both versions once.
Report templates for SEO, ads and social
The three-section page stays the same. What changes between engagements is the list of metrics in section 2 and the actions in section 1. Below are starting lists. They are our suggestions drawn from common practice, not standards, so cut them down to the client’s goal.
An SEO report template
A good SEO client report template separates visibility (are we being found), traffic (are people arriving) and outcomes (are they doing something valuable).
| Layer | Metrics to consider | Typical source |
|---|---|---|
| Visibility | Impressions and average position for target queries, ranking changes for a short list of tracked keywords | Search Console, a rank tracker |
| Traffic | Organic clicks, organic sessions, top landing pages, new pages indexed | Search Console, Google Analytics |
| Outcomes | Organic leads or conversions, revenue from organic if tracked | Google Analytics, CRM |
| Work done | Pages published or updated, technical fixes, links earned, content briefs delivered | Your own project tracker |
Leave out generic domain scores unless the client asks, and never present a rank for a keyword nobody searches. Annotate algorithm updates and site changes on the charts, and compare with the same period last year before blaming or praising anything.
A paid ads and performance report template
| Layer | Metrics to consider | Typical source |
|---|---|---|
| Spend | Spend against budget, pacing for the month | Ad platforms |
| Efficiency | Cost per lead or acquisition, return on ad spend if revenue is tracked | Ad platforms, CRM |
| Volume | Clicks, conversions, conversion rate | Ad platforms, Google Analytics |
| Work done | Tests started and read, creatives changed, audiences adjusted, budget moves and why | Your own log |
A performance marketing report template earns trust by showing the tests, not only the totals: what we tried, what happened and what we will do with it. Always state how conversions are counted, because a platform’s conversions and the client’s real leads are rarely the same number.
A social media report template
| Layer | Metrics to consider | Typical source |
|---|---|---|
| Reach | Reach and impressions by channel | Platform insights |
| Engagement | Engagement rate, saves, shares, comments | Platform insights |
| Audience | Follower change, audience mix if relevant | Platform insights |
| Outcomes | Link clicks, sign-ups or sales traced to social | Google Analytics, CRM |
| Work done | Posts by format, best and worst posts and why, campaigns | Content calendar |
A social media client report template is where vanity metrics are most tempting. Agree with the client up front which one or two outcomes decide whether the work is succeeding, and put those first.
A filled-in example
Everything here is invented: the client, the numbers and the reasons. It shows the structure and the tone, including the sentence about what is not yet known.
CLIENT: Harbor Dental Group (invented)  |  OCTOBER  |  Prepared by A. Rivera

HEADLINE
"Organic appointment requests were 41, up 21% on September, with most of the rise
coming from two new service pages."

WHAT IT PRODUCED
 | Metric                   | Oct | Sep | Oct last year | Note                          |
 | Organic appointment reqs | 41  | 34  | 29            | Two new pages account for 9   |
 | Organic clicks           | 3,120 | 2,870 | 2,410     | Up 8.7% on Sep                |
 | Avg position, 5 key terms| 8.4 | 9.1 | 11.0          | Improved on four of five terms|

WHAT CHANGED AND WHY
 The two new service pages received 9 of the 41 requests. We do not yet know why
 requests from the home page fell by 3; we will check form errors next week.
A spreadsheet that ranks your repetitive tasks by what is worth automating first. List the task, rate how often it happens, how long it takes, how error-prone it is and how many tools it touches, and the sheet orders your list. Enter your email below and we will send the download link.
An AI-assisted draft with a 15-minute review
Once the numbers are in a sheet, a language model can draft the narrative: the headline, the "what changed" paragraph and a first version of the next steps. This saves the blank-page time. It also creates a specific risk: models are good at producing a confident explanation for any change, whether or not it is true. The rules below keep the draft honest.
A prompt that limits invention
You are drafting the narrative for a monthly client marketing report.

Use ONLY the data supplied below. Rules:
- Quote numbers exactly as given. Do not round, convert or estimate.
- For each change, state the size and direction. Give a reason ONLY if the notes
  below contain one. Otherwise write: "Cause not yet established."
- Do not predict future results.
- If a metric is missing or marked REVIEW, say so. Do not fill the gap.
- Write for a busy business owner: plain words, no jargon, no hype.
- Output: (1) a one-sentence headline, (2) 3 to 5 bullet points on what changed,
  (3) "What we do not know yet" with up to 3 bullets, (4) 3 suggested next steps.

CLIENT GOAL: [goal in the client's words]
DATA (this period, last period, same period last year): [paste table]
NOTES FROM THE TEAM (actions, launches, outages, holidays): [paste notes]
The notes field matters most. A model cannot know that a competitor’s sale ran in the second week or that tracking broke on the 14th. You tell it, or it will guess.
The 15-minute review checklist
| # | Check | How |
|---|---|---|
| 1 | Every number matches the sheet | Read each figure in the draft against its source cell. Do not assume. |
| 2 | Every reason is supported | Find the note or the data behind each explanation. Delete or soften the rest. |
| 3 | No prediction slipped in | Search the draft for will, expect, likely and should. |
| 4 | The headline is true and tied to the goal | Would the client repeat it without embarrassment? |
| 5 | Missing or flagged data is stated | A gap that is hidden will be found by the client. |
| 6 | The recommendation is yours | A draft suggestion is a starting point. Make sure you would defend it. |
| 7 | The tone fits this client | Add the one detail that shows you know their business. |
- Sending the draft as written. The report goes under your agency’s name.
- Pasting client data into a tool you have not checked. Review where the data goes and how it is stored before you send client numbers to any model, and check your contract with the client.
- Letting the model explain every dip. Unsupported reasons are the biggest risk in the whole system.
- Using the same draft voice for every client. Clients can tell.
- Skipping the notes field. Without context, the draft explains nothing true.
Reporting rhythm: who gets what, and when
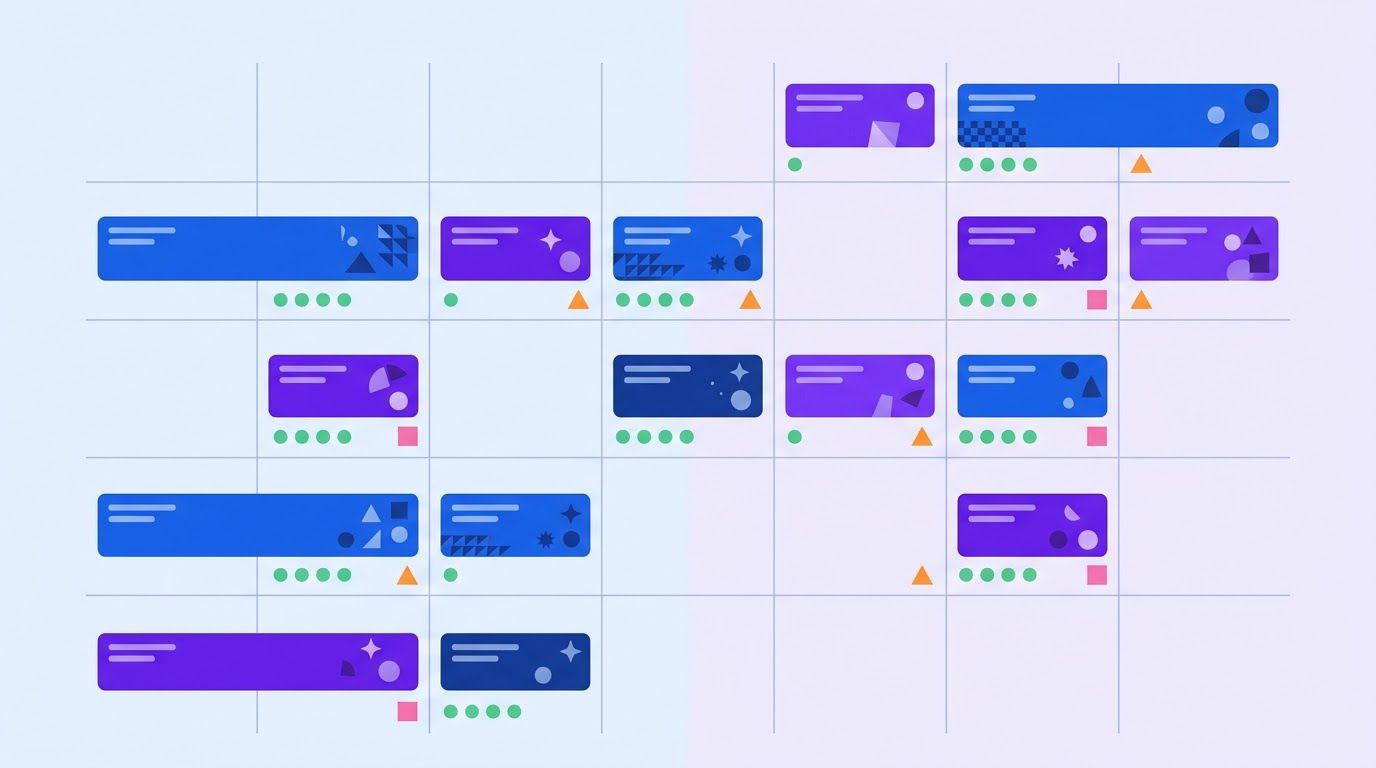
The default most agencies fall into is one report per client, on the first working days of the month. That puts every deadline on top of the others. A better design gives each client a rhythm that suits their engagement and spreads the work across the month.
| Rhythm | Who it fits | Format | Effort |
|---|---|---|---|
| Weekly snapshot | Clients with active paid spend or a launch in progress | Five numbers and two sentences, sent by email | 5 to 10 minutes if automated |
| Monthly report | Most retainer clients | The one-page report from Section 3 plus a dashboard link | About 45 minutes (Section 1 budget) |
| Quarterly review | Every retainer client | A short meeting and a deck: trends, what worked, plan for the next quarter | Several hours, and worth it |
| Alert between reports | Any client where a sudden change would matter | A message when a metric drops or jumps beyond a threshold (Section 7) | Automatic, then a person reads it |
Stagger the delivery
The assignments are invented. Instead of all 12 reports on days 1 to 3, the agency gives each client a fixed delivery day.
| Delivery day | Clients | Reason |
|---|---|---|
| 3rd | Clients A, B, C | Paid-media clients, whose month closes cleanly |
| 7th | Clients D, E, F | SEO clients, where Search Console data is complete after a few days |
| 12th | Clients G, H, I | Social clients, with a sync call booked the same week |
| 17th | Clients J, K, L | Clients with a billing cycle that ends mid-month |
Three reports a week is a workload one person can review properly. Twelve in three days is a workload that gets rubber-stamped.
The report is the start of a conversation
- Send the report 24 hours before the call, and keep the call for the decision at the bottom of the page.
- Write down what the client said and where it should go. Our guide to taking call notes into a CRM covers a five-minute routine for that, and the notes become the "what we did" and "notes from the team" inputs for next month.
- Track what the client opens or asks about. If nobody reads page four, drop page four.
Putting a price on reporting
Reporting is part of the service, so most agencies include it in the retainer, but it is a cost you should know. Using the calculator in Section 1, multiply the hours by your team’s hourly cost for each client, then divide by that client’s monthly fee. A client whose reporting eats a large share of the fee is a pricing or scope problem, not a reporting problem. If a client asks for custom reports beyond the standard page, decide in advance whether that is a paid extra.
When the month is bad
Every agency eventually has to send a report where the main number fell. How you handle that report decides more about the relationship than ten good months. A simple three-step structure keeps it honest and useful.
- Say it first. The headline states the drop plainly, with the size and the comparison. Do not make the client search for it.
- Separate what you know from what you suspect. List the causes you can support (a tracking outage, a paused campaign, a site change) and the ones you are still checking, with a date for the answer.
- Bring a plan, not an apology. Name the two or three actions you will take, who does them and when the client will hear back.
The draft prompt in Section 5 helps here, because it is told to write "Cause not yet established" where no reason exists. Resist the urge to replace that phrase with something that sounds better. A client who is told what you do not know and when you will know it tends to stay calm. A client who finds out later that the explanation was a guess does not.
Onboarding a new client to the system
- Agree the goal in one sentence before you connect a single source, and write it at the top of the sheet.
- Agree the three or four metrics that will decide whether the work is succeeding, and write their definitions in the dictionary.
- Record a baseline for the previous three months and the same period last year, so the first report already has comparisons.
- Set the delivery day and the format in writing, and tell the client who to ask when they have a question about a number.
Automating the plumbing with n8n
Layers 2 and 3 of the architecture are plumbing: collect, consolidate, check. A workflow in n8n (may be an affiliate link) can do all three on a schedule. To be clear about what exists on this site: we have no published workflow that builds a client report. Several published workflows cover neighbouring patterns, and their descriptions below come from their own entries.
What is already on this site
- The weekly accounts receivable aging report runs every Monday at 8 a.m., reads invoices from Invoice Ninja, sorts the unpaid ones into aging buckets by client, builds a one-page PDF with PDFMint and emails it through Gmail. It is the closest pattern to a scheduled report: pull, group, format, send.
- The workflow that flags slowing Zoho deals reads deals on a schedule, finds those whose activity is slowing, asks an OpenAI model for follow-up tactics and posts an alert to Slack. It is the pattern for the alerts-between-reports row in Section 6.
- The Zoho CRM data quality audit workflow checks leads, flags problems and emails one HTML report, which is a model for the data-check layer.
- The AI email reply workflow with Airtable and Gmail saves each AI answer in a table before it is sent. The same save-then-review pattern is what keeps an AI draft from reaching a client unchecked.
- Our CRM data cleanup protocol is the manual routine for keeping the source records clean.
A design that keeps a person in charge
- Schedule: a trigger starts the run on each client’s delivery day.
- Collect: the workflow reads each client’s metrics from your sources and writes them to that client’s sheet, using the metrics dictionary names.
- Check: a rule flags missing data and large swings (the function below).
- Draft: the figures, the flags and your team’s notes go to a model with the prompt from Section 5.
- Stage: the draft and the filled template are saved as Pending review, and a person is notified.
- Approve and send: a person edits, approves and sends. Nothing goes to a client automatically.
- Log: keep the draft, the edits and the final version, so you can see what the draft got wrong.
A check for missing data and sudden swings
Here is the logic of the check layer as a function you could use in an n8n code step. It compares this period with the last, and returns a flag for missing data, a metric that dropped to zero, or a change beyond a threshold. It ignores percentage swings on tiny bases, because 2 to 4 is a 100% change that means nothing. Checked on one invented example, it returned a 34.7% drop for clicks, a dropped-to-zero flag for conversions and missing-data flags for two metrics that had no current value.
function flagChanges(cur, prev, opts = {}) {
  const thr = opts.threshold ?? 0.3, minBase = opts.minBase ?? 20;
  const out = [];
  for (const k of Object.keys(prev)) {
    const c = cur[k], p = prev[k];
    if (c == null || Number.isNaN(Number(c))) { out.push({ metric: k, flag: "MISSING_DATA" }); continue; }
    if (Number(c) === 0 && Number(p) > 0) { out.push({ metric: k, flag: "DROPPED_TO_ZERO" }); continue; }
    if (Number(p) >= minBase) {
      const ch = (Number(c) - Number(p)) / Number(p);
      if (Math.abs(ch) >= thr) out.push({ metric: k, flag: ch > 0 ? "JUMP" : "DROP", change: Math.round(ch * 1000) / 10 });
    }
  }
  return out;
}
The 30% threshold and the base of 20 are starting points that we chose. Tune them per metric. A flag is a question, not an answer: a drop to zero is more often a broken connection than a real collapse, which is exactly why a person should look before the number reaches a report.
- Nothing reaches a client without a person. Staging first, sending second.
- Store credentials safely and give each connection the least access it needs. Never put access tokens in a sheet or a prompt.
- Watch for broken connections. A report built on a silently failed pull looks fine and is wrong.
- Limit what leaves your systems. Check what a model provider receives and keeps, and what your client contracts allow.
- Version your template and your dictionary. When a definition changes, say so in the report.
- Keep a manual fallback. One day a platform will change something. Know how to produce a report without the workflow.
If you would like the collection, checks and AI draft built into a workflow that stages a report for your review, describe it on the request page. We review it, send a quote, and you decide whether to go ahead.
A two-week rollout
| Day | Task | Time |
|---|---|---|
| 1 | Fill in the calculator in Section 1 with your real numbers. | 20 min |
| 2 | Pick your three biggest clients. Write each one’s goal in their own words. | 30 min |
| 3 | Write the metrics dictionary for those three clients. | 45 min |
| 4 | Build the one-page template and a sheet per client. | 60 min |
| 5 | Fill the sheets by hand for last month and write one full report with the template. Time yourself. | As long as it takes |
| 6-7 | Decide how to collect data: a reporting tool, Looker Studio connectors or a workflow. Calculate the cost for your number of sources. | 60 min |
| 8-9 | Automate the collection for one client only. | 2 hours |
| 10 | Add the change-flag check and the draft prompt. Review the first draft with the Section 5 checklist. | 60 min |
| 11 | Produce the report for that client through the new route. Compare time and quality with Day 5. | 45 min |
| 12-13 | Extend to the other two clients. Note what broke. | 2 hours |
| 14 | Set delivery days for all clients (Section 6) and decide the next five to move. | 30 min |
If it feels like too much, do Day 5 alone. Writing one report with the template and timing yourself tells you whether the problem is assembly, interpretation or both.
When it is time to hand it to someone
You can run this system with a template, a sheet per client and a reporting tool, and for the first month you should. What tends to break is the plumbing: connections that expire, a metric that is renamed, a check that nobody maintains.
At LeenLabs we build n8n workflows for tasks like this. The process is plain. You describe the task once on a single form, with your sources, the goals of the clients you report on and the checks you want. We review it and send a quote. You pay 40% to start and the remaining 60% when we deliver the workflow. There is no bidding round and no profiles to compare. We do not promise a time saving, because it depends on your reports. What we deliver is a workflow that does what your request describes.
Tell us which sources you pull from, how many clients you report on and what a good report looks like for you. You get a quote, and you decide whether to go ahead.
To see how these workflows are put together first, browse the free workflows, which come with JSON you can import, or read more about us.
Frequently asked questions
What is client reporting?
Client reporting is the recurring report or dashboard an agency sends to show a client what was done and what it produced. A good one answers three questions: what we did, what it produced and what we do next.
What should I include in a monthly marketing report?
A headline, the work completed, three to five metrics tied to the client’s goal with comparisons to the last period and the same period last year, what is not yet known, and the plan and decision for next month. Section 3 has a template.
How do I automate client reporting?
Automate the assembly, not the interpretation: collect the data into one sheet per client, check it with rules, fill a template and have a model draft the narrative. A person reviews and sends. Sections 2, 5 and 7 cover each step.
How long should a client report take?
We propose a budget of 45 minutes per client for a standard monthly report once the system is built, split into data checks, review, annotation, the cover email and logging. It is a design target we have not measured, so time your own reports first.
How much does client reporting software cost?
It varies by model. On their own pricing pages read on November 13, 2026, AgencyAnalytics listed $20 per client per month on its Core plan billed annually, and Swydo listed a $69 base including 10 data sources, then $4.50 for each of the next sources up to 100. Prices change, so check the live pages and calculate for your number of clients and sources.
Is Looker Studio free for client reporting?
A vendor blog we read says Google’s native connectors, such as Google Ads, GA4 and Search Console, are free to use, and that most non-Google sources need paid third-party connectors. We could not read Google’s own pricing page, so check it directly.
Can AI write my client reports?
It can draft the narrative from numbers you supply, which saves time. It should not explain changes without evidence, and a person should check every figure and every reason before the report goes out. The prompt in Section 5 sets those limits.
What metrics should an SEO client report include?
Visibility (impressions, position for target queries), traffic (clicks, sessions, top pages), outcomes (leads or conversions from organic) and the work done. Section 4 has a table. Choose from it based on the client’s goal.
How often should I report to clients?
It depends on the engagement. Weekly snapshots suit paid media, monthly reports suit most retainers and a quarterly review suits all of them. Staggering delivery days spreads the workload. Section 6 has a table.
How do I stop a report from showing wrong numbers?
Write a metrics dictionary, check every period against the last with a rule that flags missing data and large swings, and have a person read every number in the draft against the sheet before it is sent.
Sources
- AgencyAnalytics, Pricing. Read November 13, 2026. Core plan $20 per client per month billed annually, add-on prices, the 14-day trial, the white-labeled client portal. The page shows no effective date, and its meta description and page body differ on the starting price.
- Swydo, Pricing. Read November 13, 2026. Base price, 10 included data sources, $4.50 per source for sources 11 to 100, definition of a data source. The page shows a last update of October 30, 2026 but no price effective date, and euro and dollar figures were inconsistent.
- Swydo, Best Looker Studio connectors for marketing agencies. Published December 24, 2025; last updated November 12, 2026; read November 13, 2026. Native Google connectors described as free, and most non-Google connectors as paid. A vendor blog from a company that sells a competing product.
- Calculated by us: all arithmetic in Sections 1, 2 and 6 and in the examples. The change-flag function was checked on one invented example.
- Created by us, not tested on real agencies: the metrics dictionary, the three-section template, the 45-minute budget, the metric lists, the prompt, the review checklist, the reporting rhythm and the delivery calendar. Every client, report, figure and calendar in the examples is invented.
- Not found and therefore not quoted: the brief’s statistic that manual reporting is the top agency pain, any measured before-and-after reporting time from real agencies, Google’s own Looker Studio pricing page, and pricing for other reporting tools such as DashThis, whose page was not reachable from our working environment.
- About Us: who we are and how we work
- Free Workflows: n8n workflows with JSON you can import
- Request a Custom Workflow: describe a task and get a quote
- Terms of Service
- Privacy Policy
This article is general information and not legal, tax or financial advice. Laws and rules differ by country and state and change over time. Check with a qualified professional about your own situation.