
Cash Flow Forecasting for Small Businesses Without a Finance Team: A 13-Week Method With AI Where It Helps
It is the second Thursday of the month and the owner of a ten-person service business is looking at a bank balance that looks healthy. Payroll goes out next Wednesday. Two large customers have not paid, a quarterly tax payment is due the week after, and a supplier has just asked to be paid early. The balance is fine today. Whether it is fine in three weeks is a question nobody can answer from the bank app. (An invented scene, and a common one.)
A cash flow forecast answers that question. It lists the money you expect to receive and the money you expect to pay out, week by week, and shows what your bank balance will be at the end of each week. It is different from a profit and loss statement, which tells you whether the business makes money over time. A business can be profitable on paper and still miss payroll, because profit counts a sale when you make it and cash counts it when it arrives.
You do not need a finance team for this. You need one sheet, one hour a week and a set of habits. This guide gives you the sheet (a 13-week template with three scenarios, available as a download in Section 2), the method for filling it with data you already have, the way to build an optimistic and a pessimistic version without tripling the work, the alerts that tell you when to act, and an honest account of where AI helps and where it should not be trusted.
A note on the numbers. The popular statistic that most business failures are caused by cash flow problems has no source we could check, so we do not use it. The one figure we rely on comes from a primary study by the JPMorgan Chase Institute, and it is from 2015 data. Every example in this guide is invented, and every claim about what works in practice is labelled as our own suggestion, not a measured result.
- Forecast cash, not profit. Put each receipt and payment in the week the money moves.
- Thirteen weeks is a convention, not a law. It is long enough to see a problem coming and short enough to stay believable.
- Use the direct method. Start from the real bank balance, then list cash in and cash out. No accounting adjustments.
- Time receipts by how customers actually pay, not by the due date on the invoice.
- Build three versions, not three models. The pessimistic and optimistic cases are the base case with two settings changed.
- Draw a floor and watch it. The most useful output is the first week your balance goes below your safety line.
- Let AI sort and summarise. Do not let it predict past about three months or set your assumptions.
- Why cash, not profit, decides what you can do
- The 13-week model: the minimum that works
- Feeding the model from data you already have
- Three scenarios without tripling the work
- Alerts and the weekly routine
- Where AI helps and where it should stop
- Tracking how wrong you are
- A four-week rollout
- When it is time to hand it to someone
- Frequently asked questions
- Sources
Why cash, not profit, decides what you can do
What the research actually shows
The best data we found on how much cash small businesses hold comes from the JPMorgan Chase Institute. Its 2016 report, Cash Is King: Flows, Balances, and Buffer Days, looked at 597,000 small businesses with Chase business accounts and 470 million anonymised transactions, covering nine non-holiday months from February to October 2015.
The report defines cash buffer days as the number of days of cash outflows a business could pay from its cash balance if its inflows stopped. You calculate it as the average daily cash balance divided by the average daily cash outflow. The median small business held a buffer of 27 days. A quarter of them held 13 days or fewer, and a quarter held 62 days or more. By industry, the median ranged from 16 days for restaurants to 47 days for real estate. Labor-intensive industries averaged 23 days and capital-intensive ones 38.
| Group (JPMorgan Chase Institute, 2015 data) | Median cash buffer days |
|---|---|
| All small businesses in the sample | 27 |
| 25th percentile / 75th percentile | 13 / 62 |
| Restaurants | 16 |
| Retail | 19 |
| Construction | 20 |
| Health care services | 30 |
| Other professional services | 33 |
| Real estate | 47 |
- It is old. The data is from 2015 and the report is from 2016. Costs, rates and customer payment habits have moved since.
- It covers one bank’s customers. These are Chase business account holders in the United States, not a random sample of all small businesses.
- It describes a median, not a target. Half of the businesses held less than 27 days, and nothing in the report says that 27 is the right amount for you.
- It does not say that low buffers cause failure. It measures how much cash businesses hold, not how many closed.
The statistic we left out
You will see the claim, repeated across the web, that 82% of business failures are caused by cash flow problems. It is usually attributed to a U.S. Bank study. We read one of the pages repeating it, which attributes it to “U.S. Bank research” with no link, report title, year or author. We could not find a primary source, so we do not quote it. The point of this guide does not depend on it: you do not need a scary statistic to know that missing payroll is bad.
Work out your own buffer in five minutes
Take your average daily cash balance over the last three months, then your total cash outflow over the same period divided by the number of days. Divide the first by the second. That is your own buffer in days, using the same definition as the report.
Average cash balance over 90 days: $24,000. Total payments out over the same 90 days: $135,000, which is $1,500 per day. Buffer = 24,000 / 1,500 = 16 days. If every customer stopped paying tomorrow, this business could cover 16 days of outflows. The number alone does not say whether that is a problem. It says how little room there is for a late payment, and the forecast shows when the room runs out.
Our own suggestion, not a measured rule: compute the number now, write it down and recompute it each quarter. If it is falling, you are thinning your cushion even if profit looks fine.
The 13-week model: the minimum that works
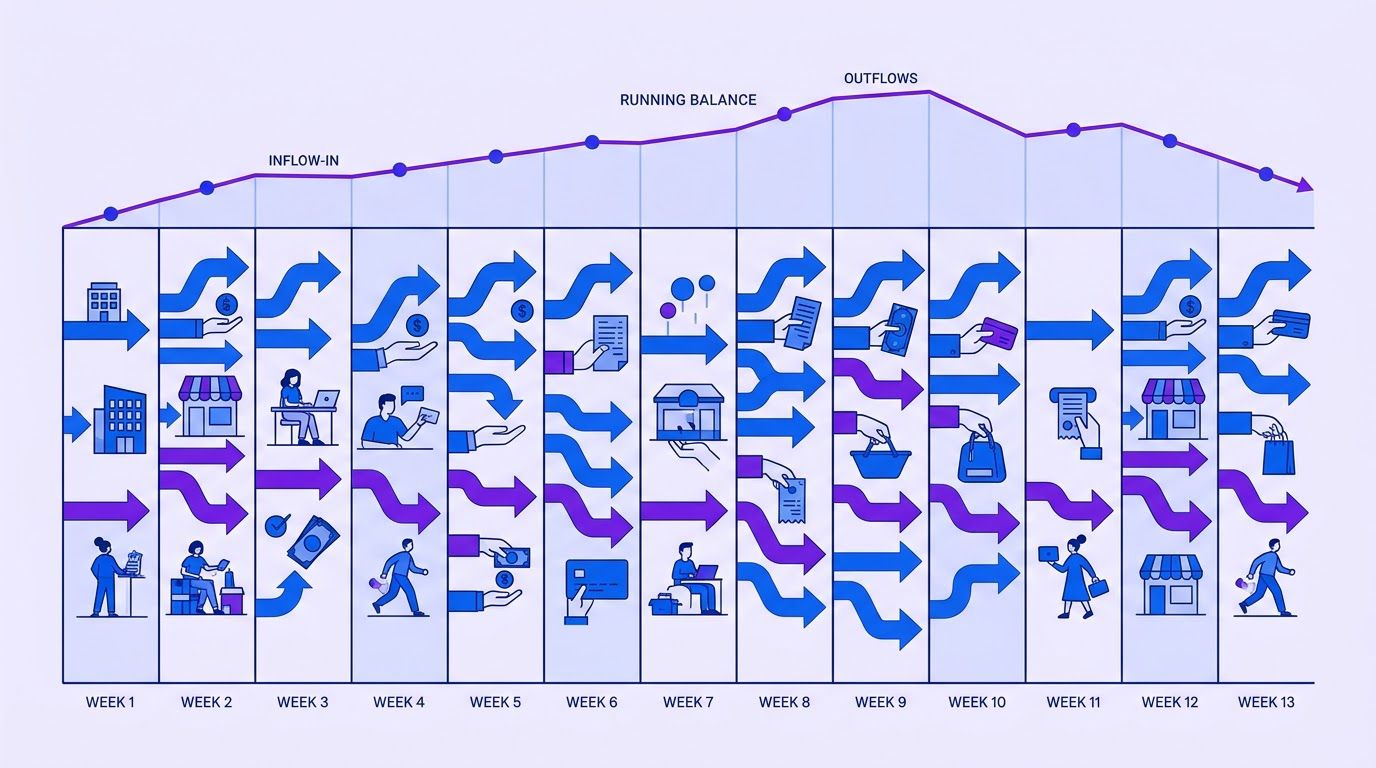
Two practitioner guides we read describe the same core design. Stampli, an accounts payable vendor, describes a rolling, weekly, direct-method forecast of cash receipts and disbursements covering one quarter, with one column per week, receipts at the top, disbursements below and ending cash at the bottom. Float, a cash flow software vendor, describes the same layout and adds that the 13-week horizon is a convention, not a rule. Both are vendors, and neither gives independent evidence that 13 weeks is optimal. We use it because it matches how businesses run: payroll, rent and tax cycles all fit inside a quarter.
Direct method, in one paragraph
The direct method forecasts only movements of cash. You start with your reconciled bank balance, add the cash you expect to receive each week, subtract the cash you expect to pay, and read the new balance. There are no accruals, depreciation or accounting adjustments. That is what makes it usable by someone without an accountant: every line is something that will appear, or will not appear, in the bank statement.
The layout
| Block | Rows | Where the numbers come from |
|---|---|---|
| Settings | Opening cash, minimum cash floor, first Monday | Your bank, and your own decision about the floor |
| Receipts | Invoices already issued; invoices not yet issued but committed; other receipts | Your aging report, your work schedule, a short list of one-offs |
| Disbursements | Payroll and payroll taxes; rent and utilities; approved supplier invoices; subscriptions; taxes; loan or card payments; one-offs | Payroll calendar, lease, approved bills, a recurring register, a tax calendar |
| Base case | Net cash flow, closing cash, below-floor flag | Formulas |
| Pessimistic | Receipts shifted later and reduced; closing cash; flag | Formulas, from two settings |
| Optimistic | Receipts raised; closing cash | Formulas, from one setting |
| Alerts | First week below the floor; lowest balance | Formulas |
Float suggests roughly 15 to 30 rows in total, with one-off items flagged separately. The template has 10 input rows, which is enough for a business with one bank account and one currency. If you find yourself needing more than 30, you have probably outgrown a spreadsheet (see Section 6).
A spreadsheet with the settings, the receipts and payments blocks, the three scenarios and the alert cells, plus an example tab filled with invented numbers. Copy it to your own Google Drive or Excel before you use it.
Rules for the inputs
- Opening cash is the reconciled bank balance, not the figure in your accounting software, which may include items that have not cleared. Float makes the same point.
- Put each item in the week the cash will move, not the week it is earned or due.
- Keep committed items apart from hopes. An invoice you have issued is committed. A deal you hope to win is not cash. Float lists counting pipeline as cash among the common failure modes.
- Model payroll first. It is the biggest and least flexible outflow for most small businesses, so it anchors the shape of the whole forecast. Float recommends the same order.
- Show one-offs on their own row so that you can see the normal pattern without them.
An invented example, week by week
The template includes an example tab with invented numbers, so you can see all three scenarios working. Here is the base case in summary. The invented business starts with $18,000 and sets a floor of $6,000, roughly two weeks of payroll and rent.
| Week | 1 | 2 | 3 | 4 | 5 | 6 | 7 | 8 | 9 | 10 | 11 | 12 | 13 |
|---|---|---|---|---|---|---|---|---|---|---|---|---|---|
| Receipts ($) | 3,000 | 5,000 | 3,500 | 3,500 | 3,500 | 3,500 | 3,000 | 3,000 | 3,000 | 3,000 | 3,000 | 3,000 | 3,000 |
| Payments ($) | 3,300 | 6,750 | 1,600 | 6,200 | 2,800 | 8,750 | 1,400 | 8,000 | 2,800 | 6,550 | 1,400 | 6,200 | 2,800 |
| Closing cash ($) | 17,700 | 15,950 | 17,850 | 15,150 | 15,850 | 10,600 | 12,200 | 7,200 | 7,400 | 3,850 | 5,450 | 2,250 | 2,450 |
All figures are invented. The balance looks comfortable for the first eight weeks and then falls, with two bumps for payroll in week 6 and a one-off purchase in week 8. In the base case it first drops below the $6,000 floor in week 10. Nothing in week 1 looks alarming. That is the point of the exercise: a problem ten weeks away is cheap to fix and expensive to ignore.
- Using due dates as payment dates. Customers rarely pay on the due date. Section 3 shows how to use their real behaviour.
- Forgetting tax and annual bills. Insurance, licences and quarterly taxes arrive in single weeks and cause the deepest dips.
- Mixing profit into the sheet. If a line is not a bank movement, it does not belong here.
- Starting from the wrong balance. An unreconciled balance carries an error into all thirteen weeks.
- Updating it once a month. A 13-week forecast that is not rolled forward weekly turns into a 9-week forecast and then a 5-week one.
Feeding the model from data you already have
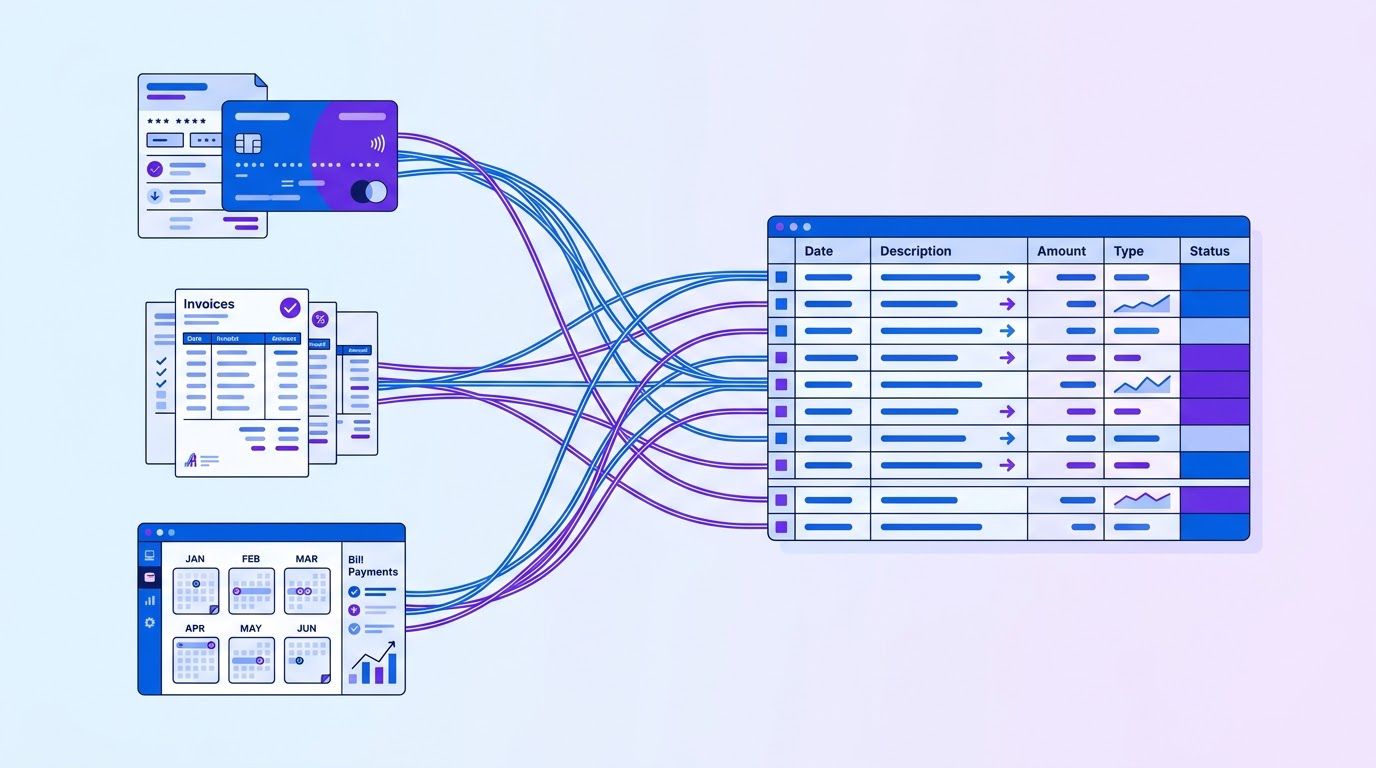
The reason most small-business forecasts die after two weeks is not the template. It is the assembly: finding the data, copying it in and checking it. Here is each input, where it lives and how to get it with as little typing as possible.
| Input | Source | How to get it | Update |
|---|---|---|---|
| Opening cash | Bank | Read the balance at a fixed cut-off, for example Monday 8 a.m. | Weekly |
| Invoices already issued | Your invoicing tool or an aging report | List each unpaid invoice with its amount and the week you expect it to clear | Weekly |
| Committed future invoices | Your project or work schedule | Only work under contract or a confirmed order | Weekly |
| Payroll and payroll taxes | Payroll calendar | Copy the next 13 weeks of pay dates and amounts | Monthly, or when headcount changes |
| Approved supplier bills | Your payables list | Bills you have approved and the week you will pay | Weekly |
| Recurring bills | A recurring register | Subscriptions, rent, insurance, loan payments, each with its next dates | Quarterly |
| Taxes and annual items | A tax calendar | Due dates and your best estimate of amounts | Quarterly |
Time receipts by how your customers actually pay
The single biggest error in a small-business forecast is assuming customers pay on the due date. Float advises timing each receipt from the aging report by when the cash actually clears, using real payment behaviour instead of stated terms. A simple way to do that with no software is a payment-behaviour table.
- List your last 20 paid invoices with the invoice date, the due date and the date the money arrived.
- For each, count the days between the due date and the arrival date. A negative number means early.
- Work out the median (the middle value) for your customers as a whole, and separately for any customer that makes up a large share of your receipts.
- Use those numbers when you place each open invoice in the sheet: due date plus the customer’s typical delay.
Customer A usually pays 2 days after the due date. Customer B pays 14 days after. Customer C pays on the due date but only half the time, and the rest takes 30 days. An invoice for $5,000 due on December 1 goes into the week of December 3 for A and the week of December 15 for B. For C, split it: put half in the first week and the other half about four weeks later. The invoice is the same in the books and the cash lands in three different weeks.
This is our own method, not a standard. It has one weakness: it assumes the past predicts the future, and a customer in trouble stops following the pattern. Treat your largest customers as risks of their own. Our guide to chasing unpaid invoices without damaging the relationship covers what to do when the pattern breaks.
What can be automated, and with what
Several workflows already on this site cover the data assembly for the receipts and the payables side. Their descriptions come from their own entries, and none of them builds a forecast on its own. They produce the clean inputs a forecast needs.
- The weekly accounts receivable aging report workflow runs every Monday at 8 a.m. from Invoice Ninja, groups unpaid invoices into aging buckets by client and emails a one-page PDF. It is the natural source for the receipts block.
- The escalating overdue invoice reminders workflow reads an invoice tracker in Google Sheets each morning and sends one of three reminders. It moves late receipts forward, and its sheet records the dates you need for the payment-behaviour table. The weekly overdue reminders workflow does a lighter version.
- The supplier invoice auto-capture workflow reads invoices from a Gmail label and logs the ones that add up to a Google Sheet, which feeds the approved-bills row. Our guide to invoice and receipt capture from email shows how to set the pipeline up.
- The invoice line item logging workflow verifies totals before they enter a sheet, and the Stripe invoice PDF workflow logs a ledger line for each successful Stripe payment, which gives you actual receipts to compare with your forecast.
- For the payables side, our guides to accounts payable automation for small businesses and to duplicate invoice detection cover keeping the approved-bills list clean.
Sorting bank transactions into the rows
The bank statement is where the actual amounts come from. Do the sorting with rules first: a text match on a payee name always goes to the same row. Use a language model only for the leftovers, with a fixed list of rows and permission to say it does not know.
You sort bank transactions into forecast rows.

Allowed rows: PAYROLL, RENT_UTILITIES, SUPPLIERS, SUBSCRIPTIONS, TAXES, LOAN_CARD,
ONE_OFF, CUSTOMER_RECEIPT, OTHER_RECEIPT, UNKNOWN.

Rules:
- Use only the description, amount and date given. Do not guess a payee's business.
- If you are not sure, answer UNKNOWN. UNKNOWN is a good answer.
- Never invent a row that is not in the list.
- Return one line per transaction: id, row, one short reason.

TRANSACTIONS: [paste lines: id, date, amount, description]
Every UNKNOWN goes to a person. Every new payee that a person classifies becomes a rule, so the model sees fewer and fewer cases. Check where any transaction data is sent before using an outside model, and do not paste account numbers.
If you want your aging report, approved bills and bank lines collected into one forecast sheet automatically, describe it on the request page. We review it, send a quote, and you decide whether to go ahead.
A spreadsheet that ranks your repetitive tasks by what is worth automating first. List the task, rate how often it happens, how long it takes, how error-prone it is and how many tools it touches, and the sheet orders your list. Enter your email below and we will send the download link.
Three scenarios without tripling the work

Most small businesses never build scenarios because they imagine three separate spreadsheets. They do not need them. The pessimistic and optimistic cases are the base case with one or two settings changed, and the settings sit in yellow cells at the top of the template.
| Scenario | What changes | Setting in the template |
|---|---|---|
| Base | Your best honest estimate | None |
| Pessimistic | Receipts arrive later and some do not arrive | Delay in weeks, and a shortfall percentage |
| Optimistic | Receipts are a little higher | An uplift percentage |
Payments stay the same in all three, because most outflows (payroll, rent, taxes) do not respond to how your customers behave. That is a simplification, and a deliberate one: it shows the downside of receipts without pretending you will cut costs in time.
The logic in code
If you want to run scenarios in an n8n code step or a script, this function does the same job as the sheet. We checked it against the invented example: it reproduces the closing balances and the first-breach week in the template, which are week 10 for the base case, week 6 for the pessimistic case with a two-week delay and a 10% shortfall, and week 10 for a 5% uplift.
function forecast(opening, receipts, outflows, floor, opts = {}) {
  const delay = opts.delayWeeks || 0;
  const cut = (opts.shortfallPct || 0) / 100;
  const up = (opts.upliftPct || 0) / 100;
  let bal = opening, low = opening, firstBreach = null;
  const closing = [];
  for (let w = 1; w <= receipts.length; w++) {
    const src = w - delay >= 1 ? receipts[w - delay - 1] : 0;
    const rec = src * (1 - cut) * (1 + up);
    bal = bal + rec - outflows[w - 1];
    closing.push(Math.round(bal));
    if (bal < low) low = bal;
    if (firstBreach === null && bal < floor) firstBreach = w;
  }
  return { closing, lowest: Math.round(low), firstBreach };
}
What the example shows
| Scenario (invented numbers) | Lowest closing cash | First week below the $6,000 floor |
|---|---|---|
| Base | $2,250 | Week 10 |
| Pessimistic: 2 weeks late, 10% lower | -$7,250 | Week 6 |
| Optimistic: 5% higher | $4,250 | Week 10 |
Two lessons come out of the table, and they apply beyond the example. First, the optimistic case barely changes the answer, because the problem comes from the shape of the outflows, not from small differences in receipts. Second, delay hurts more than shortfall. A receipt that arrives two weeks late is not lost, but it leaves a hole at exactly the moment a payroll week lands.
- Pessimistic delay: look at your payment-behaviour table and use the delay of your slowest large customer, or the 75th percentile of delays if you have enough invoices.
- Shortfall: think about the one customer whose non-payment you could not absorb and size the shortfall to roughly that share of receipts. This is judgement, not a formula.
- Uplift: keep it small. If the plan only works with a big uplift, it is a hope, not a forecast.
- Write the reason next to every setting. In three months you will not remember why you chose 10%.
What to do when the pessimistic case breaks your floor
| Lever | Effect | Cost or risk |
|---|---|---|
| Chase the largest open invoices earlier | Moves receipts forward | Strain with the customer. Use a calm, scripted approach. |
| Move discretionary payments by a week or two | Moves payments back | Late fees or strained supplier terms. Ask first. |
| Delay a one-off purchase | Removes an outflow | Whatever the purchase was meant to do is postponed |
| Arrange a credit line before you need it | Adds a backstop | Fees and interest, and banks lend more readily when you do not need the money. Talk to your bank. |
| Ask for deposits or milestone payments on new work | Pulls receipts earlier | Needs customer agreement and a change to your terms |
None of these is a recommendation for your business, and we are not financial advisers. The point is to know your options ten weeks before you need them, which is the only time most of them are cheap.
Describe your sheet, your bank and invoicing tools and the floor you want to protect. We review the request, send a quote, and you decide whether to go ahead. You pay 40% to start and 60% on delivery.
Alerts and the weekly routine
A forecast helps only if somebody looks at it at the same time each week. Both vendor guides we read describe a weekly cycle: replace the finished week with actual figures, correct the weeks ahead and add a new week at the end. Float suggests doing it on Monday, with a 20 to 30 minute cash review where the forecast informs decisions on payments and hiring. Stampli suggests limiting the variance review to the ten largest misses. Both are vendors, and neither backs the timings with a study, so treat them as reasonable starting points.
A 45-minute Monday
As with our other time budgets, this one is a proposal, not a measurement. Time yourself for four weeks and adjust.
| Minutes | Task | Done by |
|---|---|---|
| 5 | Read the bank balance at the cut-off and enter it as the new opening cash | Person |
| 10 | Enter last week’s actual receipts and payments next to what you forecast. Note the three biggest differences. | Person, or a workflow that pulls the lines |
| 10 | Update the open invoices: mark paid ones, move late ones using the payment-behaviour table | Person |
| 5 | Add this week’s new commitments: approved bills, new work, new one-offs | Person |
| 5 | Add the new week 13 | Person |
| 10 | Read the alerts and decide: is any action needed this week? | Person |
Alert rules
The template computes the first week below your floor and the lowest balance for the base and pessimistic cases. Turn those into a rule that tells you what to do, not just what the number is.
| Condition | Level | What to do |
|---|---|---|
| Base case below floor in weeks 1 to 4 | Red | Act this week: chase receipts, move payments, talk to the bank today |
| Base case below floor in weeks 5 to 8 | Amber | Plan the levers in Section 4 and pick one to start now |
| Pessimistic case below floor in weeks 1 to 8 | Amber | Prepare a backstop, for example an agreed credit line or a customer call |
| Pessimistic case below floor in weeks 9 to 13 only | Watch | Note it and check it again next Monday |
| No breach in either case | Green | Nothing to do. Spend the 10 minutes on the variance log. |
The week bands are our own suggestion. They reflect a belief, shared by the vendor guides, that near weeks are more reliable than far ones, but we found no study that sets the boundaries, so adjust them to your business.
An alert message
Subject: Cash check, week of {{monday}}: {{level}}

Opening cash today: {{opening}}
Floor: {{floor}}
Base case: first week below floor = {{base_breach}} (lowest balance {{base_low}})
Pessimistic case: first week below floor = {{pess_breach}} (lowest balance {{pess_low}})

Largest 3 differences from last week's forecast:
{{variance_1}}
{{variance_2}}
{{variance_3}}

Suggested action: {{action}}
Open the sheet: {{sheet_link}}
A design for an automatic alert
- Trigger: a schedule, Monday 7 a.m.
- Read: the forecast sheet’s settings and the alert cells.
- Check: if the opening cash cell was not updated since last Monday, send a reminder instead of an alert, because an alert from stale data is worse than none.
- Compute: the level from the table above.
- Send: the message above to you and one other person, so nothing depends on one inbox.
- Log: the level and the date, so you can see how often you were red.
- The workflow alerts, a person decides. It never moves money, pays a bill or emails a customer.
- Stale data cancels the alert. If the balance was not updated, say so instead of showing old numbers.
- Send to two people. One person on holiday should not mean no alert.
- Keep the floor in a visible cell, not buried in a formula. It is a decision, and decisions should be easy to change.
- Review the thresholds after a month. Too many red weeks and people stop reading them.
Where AI helps and where it should stop
Marketing for cash flow tools promises that AI will forecast your cash. We found no independent evidence that AI forecasting does better than a careful weekly spreadsheet for a small business with a few dozen invoices a month, and the vendor pages we read give accuracy targets without sources. Stampli calls its own accuracy figures “commonly cited practitioner targets” with no named source, and Float notes that accuracy figures are not backed by independent research. So here is a conservative division of labour.
| Good use | Poor use |
|---|---|
| Sorting bank lines into the forecast rows, with UNKNOWN allowed | Forecasting receipts for months ahead from a handful of invoices |
| Summarising the three biggest variances in plain language | Setting the pessimistic settings or the floor |
| Drafting a polite chase email for an overdue invoice you approve | Sending the email without review |
| Spotting unusual lines, for example a bill twice the usual amount | Deciding which bills to delay |
| Reading a PDF invoice into fields, with a check on the totals | Writing amounts into the forecast without a person looking |
Why not predict far ahead
Our own suggestion, which we cannot prove, is not to ask a model to predict beyond about the next three months. The reason is statistical and simple: with a few dozen invoices a month, a model has very little to learn from, and in the weeks beyond your current invoices the receipts depend on sales that have not happened yet. The vendor guides agree on the direction. Stampli notes that weeks five and later often rely on invoices not yet received, and Float expects the far weeks to be directional only. In those weeks, a human assumption you wrote down is more honest than a confident number from a model.
A prompt for the variance summary
Summarise last week's forecast errors for the owner.

Use ONLY the table below. Rules:
- For each of the three largest differences, say in one sentence: what it was, the size,
  and whether it looks like TIMING (right amount, wrong week), AMOUNT (different amount)
  or ASSUMPTION (the forecast rested on something that turned out wrong).
- If the table does not give enough detail to classify a difference, write UNKNOWN.
- Do not suggest actions. Do not predict next week.

TABLE: [paste: row, forecast, actual, note]
When a spreadsheet is no longer enough
Both vendor guides say a spreadsheet works while one person can maintain it. Stampli says Excel suffices while weekly data assembly takes under an hour. Float names several signs it is time for software: multiple entities or currencies, rising receivables, a weekly refresh that keeps slipping and several people editing the same file. These are vendor views, and vendors sell the software, but the signs are plausible. Our suggestion: if the weekly update has slipped twice in a month, fix the process before buying anything, because software does not stop people from skipping a Monday.
- Trusting a smooth curve. A forecast with no visible uncertainty is hiding it.
- Pasting sensitive data into a tool you have not checked. Review where the data goes and how it is stored first.
- Letting the model choose categories. Fix the list of rows and let it pick from it.
- Buying a forecasting tool to avoid the weekly habit. The habit does most of the work.
Tell us where your bank lines and invoices live and which rows you use. We review the request, send a quote, and you decide whether to go ahead.
Tracking how wrong you are
No forecast is right. The useful question is how wrong, and in which direction. A forecast you have never compared with reality is a guess with formatting. Float recommends adding a forecast-versus-actual layer from the start and says accuracy improves after roughly 10 to 12 weekly cycles. We cannot verify that, but the habit makes sense: you learn where your own assumptions are weak.
A simple variance log
week | row | forecast | actual | difference | type (TIMING / AMOUNT / ASSUMPTION) | note
2026-11-16 | Customer receipts | 3,000 | 2,100 | -900 | TIMING | Customer B paid 9 days late
2026-11-16 | Supplier bills | 1,500 | 1,500 | 0 | |
2026-11-23 | Taxes | 0 | 400 | +400 | ASSUMPTION | Forgot a quarterly fee
The three types matter because they lead to different fixes. A timing difference means the amount was right and the week was wrong, so update the payment-behaviour table. An amount difference means your estimate was off, so check the source. An assumption difference means the forecast rested on something that did not hold, which is usually the most useful to understand.
Measuring error in one number
To track accuracy, add up the absolute differences between forecast and actual receipts, then divide by the total of actual receipts. This gives a percentage error that treats early and late misses the same way.
Forecast receipts: 3,500, 3,500, 3,000, 3,000. Actual receipts: 2,800, 3,900, 2,100, 3,000. Absolute differences: 700, 400, 900, 0, which add up to 2,000. Total actual receipts: 11,800. Error: 2,000 / 11,800 = about 17%. The number says nothing on its own. What matters is whether it falls over the following weeks and whether the weeks you forecast four weeks ahead are worse than those you forecast one week ahead.
Do not compare your percentage with anyone else’s. We found no trustworthy benchmark for small businesses, and the vendor figures we saw were unsourced.
Using the log
- Compare near and far weeks. Record the forecast for each week as it stood four weeks earlier and one week earlier. If the far version is much worse, give the far weeks less weight in decisions.
- Find the repeat offenders. If one customer or one bill appears in the log three times, change its row, not its excuse.
- Look at direction. If you are always wrong in the same direction, your assumptions are biased and you can correct them.
- Do not punish misses. The goal is to improve the next forecast, not to be right.
A four-week rollout
| Week | Task | Time |
|---|---|---|
| 1, day 1 | Copy the template. Enter opening cash, the floor and the first Monday. Compute your buffer days. | 30 min |
| 1, day 2 | Enter payroll, rent and recurring bills for 13 weeks from your calendars. | 45 min |
| 1, day 3 | Enter open invoices and place each in the week you expect it to clear. Use due date plus typical delay. | 60 min |
| 1, day 4 | Build the payment-behaviour table from your last 20 paid invoices. | 45 min |
| 2 | First Monday routine. Replace the week with actuals, roll forward, start the variance log. | 45 min |
| 2 | Choose the pessimistic settings and write the reasons next to them. | 20 min |
| 3 | Second Monday routine. Look at the first variance summary and fix one recurring miss. | 45 min |
| 3 | Set the alert thresholds and decide who receives the alert. | 20 min |
| 4 | Third Monday routine. Compute your first error percentage. | 45 min |
| 4 | Decide what to automate first. Usually it is pulling the aging report or sorting bank lines. | 30 min |
If it feels like too much, do only day 1 and the Monday routine. A single sheet with opening cash, payroll, rent and your ten largest invoices already shows more than the bank app does.
When it is time to hand it to someone
You can run this forecast with a sheet and a Monday habit, and for the first month you should. What tends to break is the habit: the balance nobody updated, the invoice nobody moved, the alert that stopped being read.
At LeenLabs we build n8n workflows for tasks like this. The process is plain. You describe the task once on a single form, with your bank and invoicing tools, your sheet and the rules you want applied. We review it and send a quote. You pay 40% to start and the remaining 60% when we deliver the workflow. There is no bidding round and no profiles to compare. We do not promise forecast accuracy or any financial outcome, because they depend on your customers, your costs and your assumptions. What we deliver is a workflow that does what your request describes.
Tell us where your balance, your invoices and your bills live and what a good Monday looks like. You get a quote, and you decide whether to go ahead.
To see how these workflows are put together first, browse the free workflows, which come with JSON you can import. For finance steps that sit next to the forecast, read our guide to what AI agents can safely automate in finance or learn about us.
Frequently asked questions
What is a cash flow forecast?
A cash flow forecast is a list of the money you expect to receive and pay out in future weeks or months, with the expected bank balance at the end of each period. It differs from a profit and loss statement because it counts cash when it moves, not when a sale is made.
What is the difference between a cash flow forecast and a cash flow projection?
In everyday use the terms are close to interchangeable. Some people use forecast for the short, detailed view over weeks and projection for longer, rougher views over years. This guide uses forecast for the 13-week weekly view.
Why 13 weeks?
It is a convention that fits one quarter of payroll, rent and tax cycles. Float describes it as adjustable. We found no study showing 13 is optimal. Use a shorter horizon if your business is very predictable and a longer one if you have large seasonal swings.
What is a rolling cash flow forecast?
A rolling forecast keeps the same length by adding a new week at the end as each week finishes. A 13-week rolling forecast always shows the next 13 weeks, and you update it every week with actual figures.
How do I do a cash flow forecast in Google Sheets or Excel?
Enter the reconciled bank balance, list receipts and payments by week, subtract total payments from total receipts for each week and carry the balance forward. The template on this page does this, and it works in Excel and Google Sheets.
What is a good minimum cash floor?
There is no universal figure. A common way to think about it is the number of weeks of payroll and fixed costs you want covered. The JPMorgan Chase Institute found a median of 27 days of outflows in 2015 data, but that is a description of what businesses held, not a recommendation. Set the floor with your accountant.
How accurate should a cash flow forecast be?
We do not quote a target. The figures we saw on vendor pages were unsourced. Track your own error, as shown in Section 7, and expect near weeks to be more reliable than far ones.
Can AI forecast my cash flow?
AI can sort bank lines, summarise variances and draft chase emails. We found no independent evidence that it forecasts better than a weekly spreadsheet for a small business, and we suggest not asking it to predict beyond about three months.
Do I need cash flow forecasting software?
Not at the start. Vendor guides say a spreadsheet works while one person can maintain it in under an hour a week. Consider software when you have several entities or currencies, when the weekly refresh keeps slipping or when several people edit the same file.
What should I do if the forecast shows I will run out of cash?
Act while the problem is weeks away. Options include moving receipts forward, moving payments back, delaying a purchase, asking for deposits or arranging a credit line before you need it. Talk to your accountant or bank. This guide is not financial advice.
Sources
- JPMorgan Chase Institute, Cash Is King: Flows, Balances, and Buffer Days. Published September 1, 2016; read November 15, 2026. Sample of 597,000 small businesses and 470 million transactions, February to October 2015, definition of cash buffer days, median of 27 days, quartiles and industry medians. Primary source, but old and limited to one bank’s customers.
- Stampli, 13-Week Cash Flow Forecast. Last modified June 23, 2026; read November 15, 2026. Rolling weekly direct-method structure, update cadence, spreadsheet limits. Stampli sells accounts payable software. Its accuracy targets have no cited source and we do not use them.
- Float (Polly Wong), 13-Week Cash Flow Forecast. Dated July 31, 2026; read November 15, 2026. Inputs, opening balance, timing receipts by real payment behaviour, payroll first, 15 to 30 rows, weekly cycle, signs to move beyond a spreadsheet. Float sells cash flow software and aims at teams larger than a micro-business. We do not use its unlinked statistics.
- Crestmont Capital, Cash Flow Risk Benchmark Report. Dated April 2, 2026; read November 15, 2026. Read only to see how the “82%” claim is attributed (to U.S. Bank research, with no link, title, year or author). We do not repeat the figure.
- Calculated by us: the buffer-days example, the closing balances and scenario results in the invented example (checked against a spreadsheet recalculated in LibreOffice and against the scenario function in Node), and the error percentage in Section 7.
- Created by us, not tested on real businesses: the template, the layout of rows, the payment-behaviour method, the sorting and variance prompts, the alert levels and week bands, the 45-minute Monday and the four-week rollout. Every business, customer and number in the examples is invented.
- Not found and therefore not quoted: a primary source for the “82% of failures” claim, a trustworthy accuracy benchmark for small-business cash forecasts, independent evidence that AI forecasting beats a weekly spreadsheet for small businesses, and cash buffer data newer than 2015.
- About Us: who we are and how we work
- Free Workflows: n8n workflows with JSON you can import
- Request a Custom Workflow: describe a task and get a quote
- Terms of Service
- Privacy Policy
This article is general information and not legal, tax or financial advice. Laws and rules differ by country and state and change over time. Check with a qualified professional about your own situation.